Matlab Portfolio
Projects
Coronavirus database reader and plotter
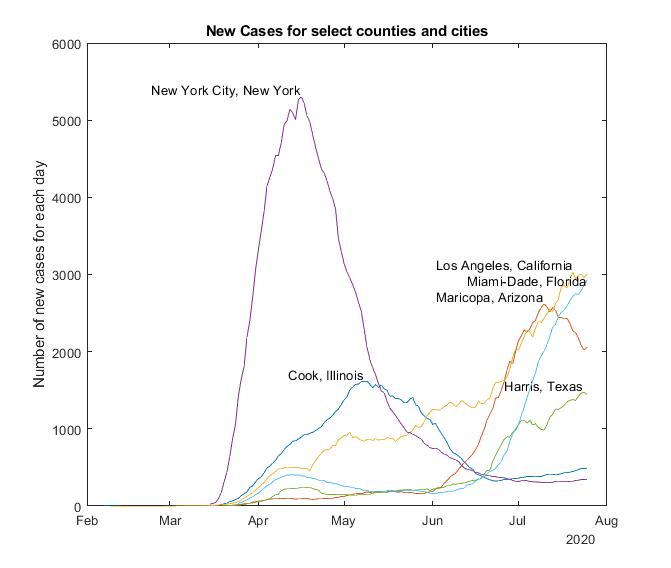 I made a collection of scripts and functions that analyzes the New York Times’ Nationwide Coronavirus casecount database.
The first image shows a 14 day rolling average of newly reported cases. Swipe to either side or use the buttons to see the other picture. The second image shows overall reported cases, NOT just active cases.
The database, available here, contains an entry (within us-counties.csv) for each count with a number of cases reported for that day. This form is nearly completely unusable for direct reading, as its over 360 thousand lines long. By first turning the database into a manageable MATLAB struct, I can better use and graph the data, as seen in the following pictures The function I made runs through every single entry in this database, and collects them all into separate struct entries, collating their case counts, fatality counts, and corresponding dates into manageable MATLAB arrays that can be plotted at will. The Struct has 3 layers, each of which ordered alphabetically:
- State
- County
- type of data, including:
- Dates
- Cases
- Fatalities
Golden Ratio Injector Plate
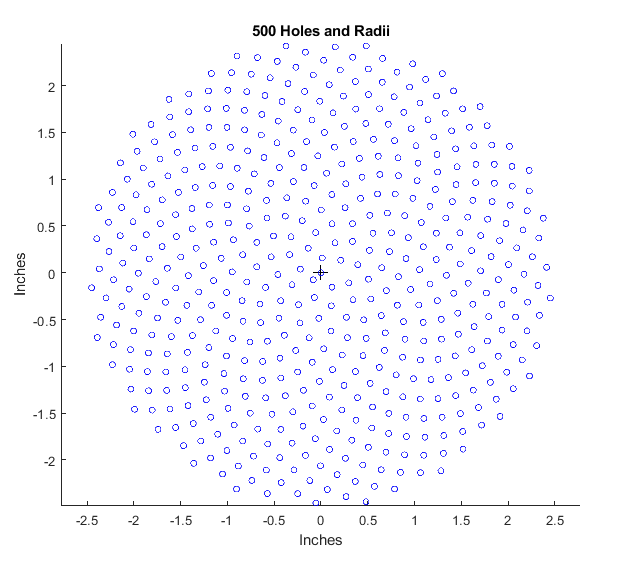 One main area of Rocket Engineering is in fuel/oxidizer injector design. For the OSU Hybrid Rocket team, our machining capabilities are limited, so we must use simpler designs. This picture illustrates 500 nozzle size and locations, for use in a simple injector plate. I made the MATLAB script that first uses the ‘golden ratio’ to calculate 500 candidate locations for injector plate nozzles, then uses a gaussian function to ‘stretch’ the holes near the center of the plate outward, as to reduce crowding and increase strength, as this plate is subjected to subzero temperatures and ~750 psi on one side, and thousands of degrees (and slightly lower pressure) on the other.
Landing Location Predictor
I don’t have an output picture for this code yet, as Coronavirus has severely restricted hobby rocket launches in Oregon, and around the US. This code has many functions, all compartmentalized within their own functions. Together they form a kit rocket landing prediction program, that works in conjunction with 2 of my other projects: my TelemetryRX box, and my rocket Electronics bay ( viewable here). A list of the functions I coded for this project:
- ser_readline()
- This function makes up for MATLAB’s recent deprecation of an important serial function by handling serial inputs and checking for errors within
- parseforinfo()
- reads the text outputted by ser_readline() for important telemetry information, and organizes it into a struct for ease of use
- append_and_save()
- records the structs from parseforinfo() into a struct database that is updated on receiving a packet. in case of any errors, the struct that this function saves (into an independant file) can be read to recover data.
- landingpredict()
- This uses the last 20 telemetry packets to estimate the rocket’s landing location. Simple linear extrapolation is used because a rocket under parachute has all forces balanced (roughly). This means no acceleration (after reaching its slow terminal velocity), and that the rocket has a nicely predictable trajectory.
- choosecomport()
- prompts the user to select the correct COM (serial) port from a list.
Orbital Plotting and data analysis.
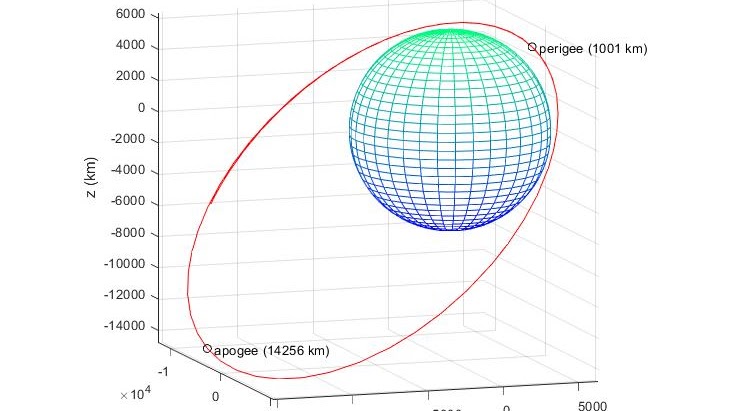 This illustrates a simple orbit with labeled perigee and apogee. It was generated from a state vector, and simulated using ode45, a numerical solving method for differential equations.
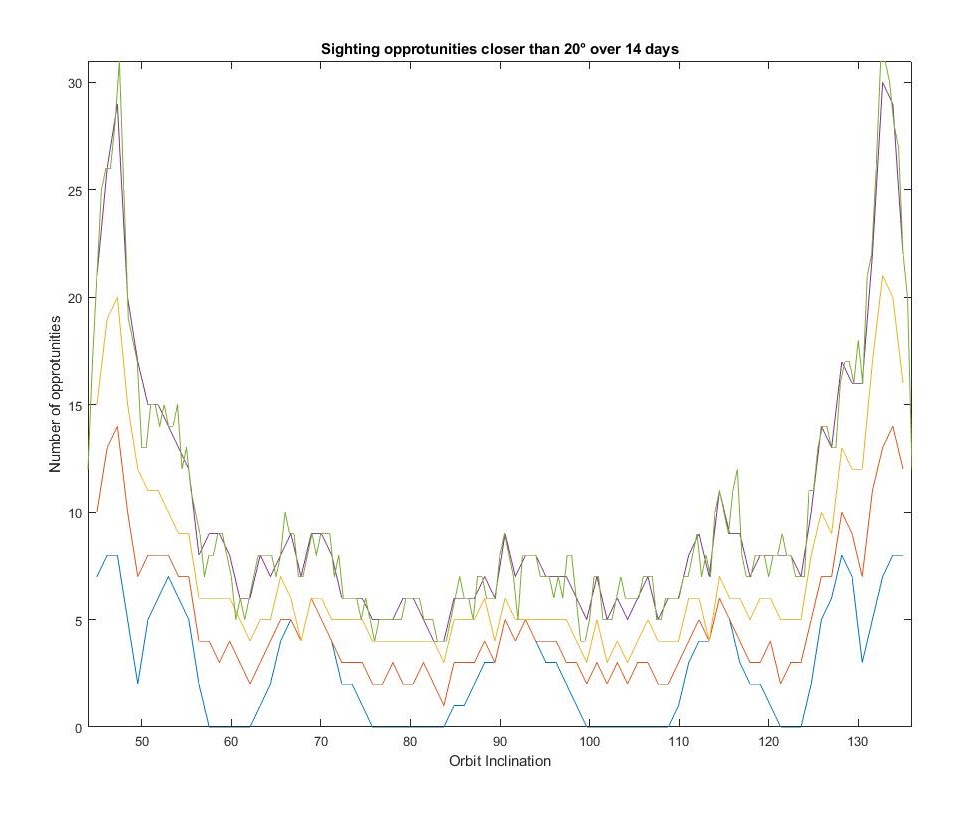 This graph was used to pick an orbital inclination for a scientific satellite (in a school project). The specific requirements for this satellite were that it must have a constant altitude of 500 miles above sea level, and that it get as many opportunities to pass over or nearly over the city of Portland, OR. This limited our choices for orbital parameters down to several not very important ones, and Inclination.
To generate this graph, we first generated a list of candidate inclinations, then generated orbital state vectors using them. These state vectors were then simulated over a series of time periods, to count the number of times the satellite was within 20 degrees of directly overhead of Portland. These numbers were then collected into this graph.
This graph was used to pick an orbital inclination for a scientific satellite (in a school project). The specific requirements for this satellite were that it must have a constant altitude of 500 miles above sea level, and that it get as many opportunities to pass over or nearly over the city of Portland, OR. This limited our choices for orbital parameters down to several not very important ones, and Inclination.
To generate this graph, we first generated a list of candidate inclinations, then generated orbital state vectors using them. These state vectors were then simulated over a series of time periods, to count the number of times the satellite was within 20 degrees of directly overhead of Portland. These numbers were then collected into this graph.
The different color lines represent simulations over 4, 7,10,14, and 21 days. The best inclination for this satellite was found to be about 47 degrees above the equator, which is slightly more north than Portland itself. The graph has a sharp drop off on the left side due to the fact that a satellite in an orbit with too low of an inclination will never (barring catastrophe) fly above its target. Towards the middle the graph levels out, as random chance dominates more or less when and for how long the satellite is above its target. Towards the right, the satellite has a retrograde orbit, and we find that at ~134 degrees we have another peak of sighting opportunities. Please also note that I rant this simulation first checking 80 orbits within this range (roughly 1 ever 1.2 degrees), then I ran just the 14 day simulations for orbits in steps of 0.5 degrees.
Pressure Vessel Design
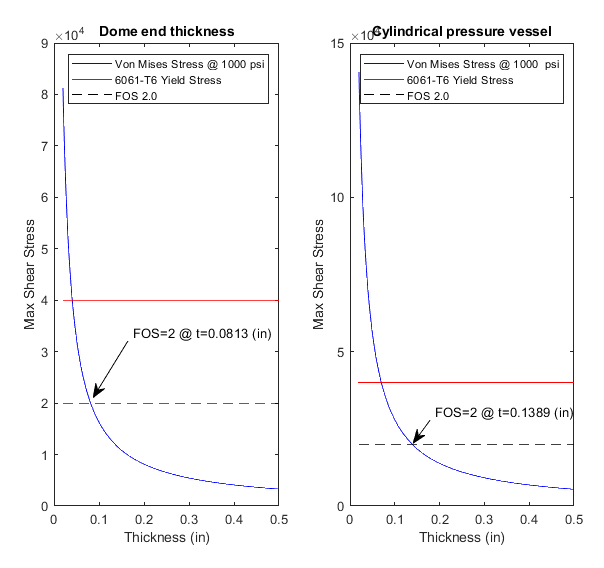 This script uses von mises stress to determine the minimum thickness of an aluminum pressure vessel tank wall such that we achieve a Factor of Safety (FOS) of 2.
To do this it first calculates the von mises stress of a multitude of candidate thicknesses’ 3D stress states, then finds the thickness corresponding to a factor of safety of 2. This is then displayed to the user. Notice that the thickness required for a hemispheric dome pressure vessel wall is ~1/2 the thickness required for a cylindrical wall. This is accurate, and due to slightly different stress matrices for each situation.
Persistence of Vision Display
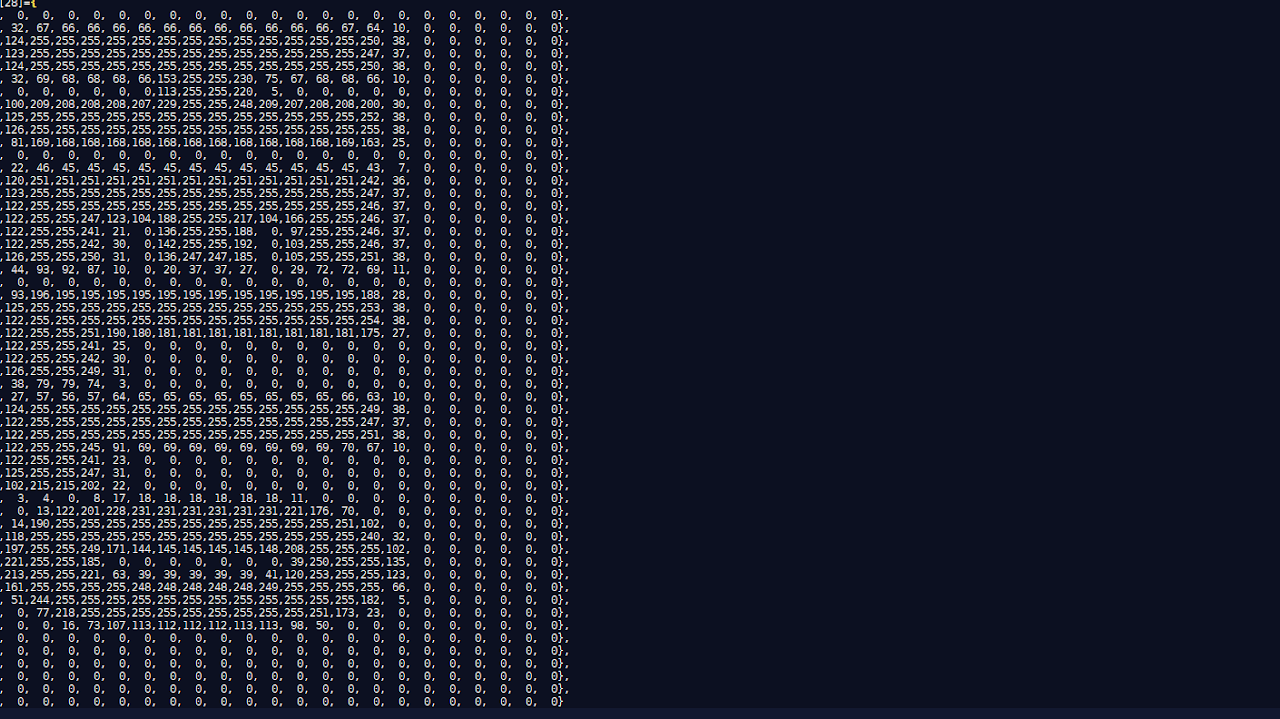 This MATLAB script takes an image input, scales it down if necessary, then outputs the Arduino code for inputting into the arduino IDE directly. simply copy and paste the output into a specific arduino script, then upload to the arduino!
Interference Pattern Rendering
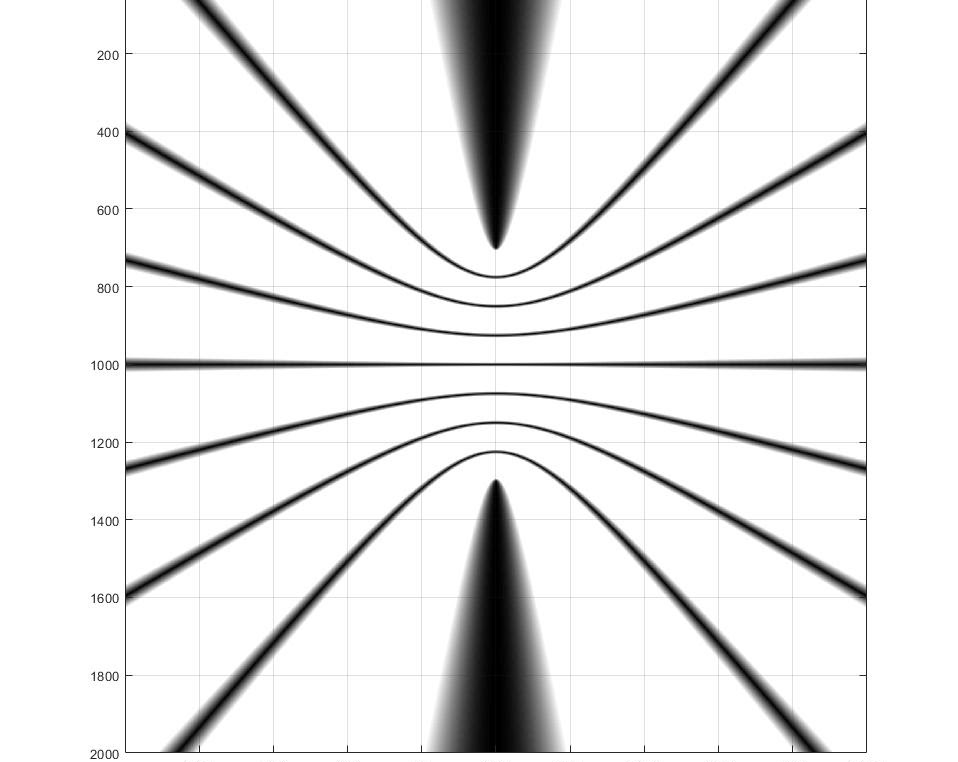 This script plots the interference pattern of two ideal speakers playing the same frequency tune in an empty environment. This was more of a ‘just for fun’ exercise. The black lines and regions represent places where the sound waves constructively interfere.
Mandlebrot Set and Chaos Theory
 These scripts render (crudely) these mathematical phenomena, both in 4k! They probably scale to your display, but you should be able to download them if you’d like.